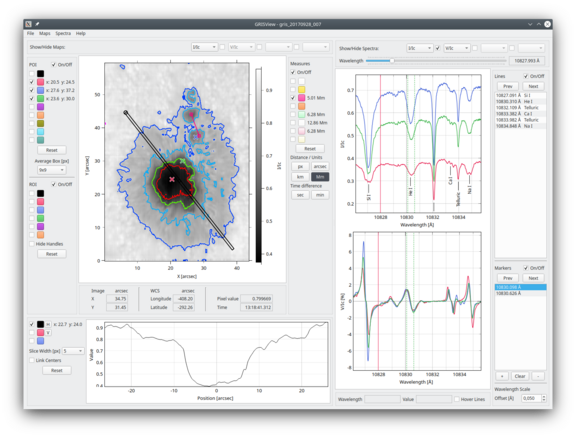
GRISView
GRISView is a visualization and analysis tool to work with GRIS/GREGOR calibrated datasets as
distributed by SDC website. It is written in Python with GUI made using Qt cross-platform framework.
GRISView features include:
- Quick panning and zooming of maps and spectra
- Multiple POI (point-of-interest) and ROI (rectangle-of-interest) for easy inspection and comparison of spectral profiles across the map
- Distance measurement between map points in different units
- Interactive image color bars to show histograms, adjust image contrast, set and customize color schemes
- Building profile plots along selected directions
- Generating contours for maps using color schemes and interactive levels adjustment
- Browsing spectra using the mouse and keyboard, quick navigation through spectral lines and markers
- Relative wavelength scale for quick difference evaluation at selected cursor position
- Showing input and derived Stokes parameter plots with Quiet Sun continuum normalization
- Support for single-map observations and multi-map time-series, including IFU and spectroscopic mode data
- Viewing observation file headers
- Exporting spectral and map plot view area as images
- Saving and restoring working sessions
For more info and download, check out:
https://gitlab.leibniz-kis.de/sdc/gris/grisview
